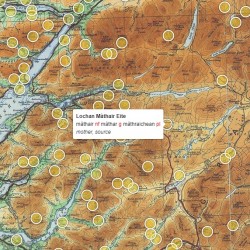
*meiotic*
  • CV
  • EdSci Sems
  • InHab50
  • Papers
  • Research
  • Quiz
  • Talks
  • Wanders
  • Whisky

GIS

Bloomin Algae 2019 - static

Animating Time: QGIS & FFmpeg

Posted on 6th September 20197th September 2019 by meiotic

I was recently asked if I could animate this summer’s records from the Bloomin’ Algae App, to help show the spatial patterns as well as the impact of a recent media interest in the subject

Tagged animation, ffmpeg, GIS, QGIS, research, time Leave a comment
UK Wind Data - 25m above ground

UK Wind Data – TIFFs (free)

Posted on 8th December 20168th December 2016 by meiotic

It’s very hard to get decent observed wind data for the UK (and most countries, I imagine), so I was intrigued when I found a 1km resolution database of wind data freely available online. You

Tagged data, GIS, research, UK, wind Leave a comment
Wednesday Wanders - animated journeys

Animating Journeys as Maps

Posted on 2nd December 20163rd December 2016 by meiotic

Over a few years going on Wednesday Wanders, I’ve collated quite a lot of data on walking routes in and around Edinburgh. In some cases this is time-stamped GPS data taken from the walk, otherwise

Tagged analysis, data, GIS, maps, wanders 4 Comments
After filling the blimp, we soon discovered taking aerial photography from a glorified balloon isn't easy

Blimp-based aerial archaeology, circa 2006

Posted on 23rd April 201623rd April 2017 by meiotic

Many years ago now, I was part of a group looking at archaeological GIS and experimenting with the use of a small blimp and remote camera for the purposes of scientific research. These days you

Tagged analysis, blimp, GIS, research Leave a comment
name_that_lake_spine_road_magn

Name That Lake!

Posted on 26th February 201618th January 2017 by meiotic

Two things coincided this week. The imminent launch of our new UK Lakes Portal illuminated how few lakes we have recorded names for, whilst a visiting work experience student was needing something to do… It

Tagged GIS, lakes, maps, research 2 Comments
miss_ark_gif2

Meander Maps (aka jQuery Slider GIS)

Posted on 29th December 201514th October 2019 by meiotic

I forget exactly how I first came across this topic, but it’s likely I’d found out there was a town in America called England. When I saw where it was, I panned across the landscape

Tagged GIS, maps, old maps, rivers Leave a comment
seabirds_screenshot

Seabird Density Visualisation, British Isles

Posted on 21st November 20155th January 2016 by meiotic

I wanted to do a pretty simple GIS task with some nice visualisation, and in the course of my work had stumbled upon the ‘Magic’ site the government has set up. It’s not the flashiest

Tagged analysis, birds, GIS, magic, research, seabird Leave a comment
3d_view_sm

Mexican Hexagons! Heat mapping Vienna and more..

Posted on 9th May 201525th May 2015 by meiotic

Isn’t it amazing how much Mexico looks in no way like north-eastern Austria? But Mexico is hot, and here we’re taking a look at heat mapping.. Having recently seen demos on both hexagonal heat maps and the Qgis2threejs

Tagged data, GIS, open data, QGIS, visualisation 1 Comment


I'm Phil. I live, work and play in Edinburgh, Scotland. I spend my work time being an Environmental Scientist and tweeting about @ScienceAndMaps, with much of my free time being used helping run Southside Whisky Club. I spend some of my evenings wandering around hidden Edinburgh. I'm a regular pub quizzer and do badly at the Hot 100. I post daily about whisky, whilst my research can be explored on my Research Gate. I'm co-founder of the whisky experiments site Maltiply, and tweet a bit for that too. I set up and run the open source academic geospatial data service Contours.