I wanted to do a pretty simple GIS task with some nice visualisation, and in the course of my work had stumbled upon the ‘Magic’ site the government has set up. It’s not the flashiest of sites but has some decent data behind it, and I went for the seabird nesting count data as it’s something I’d be interested in visualising.
- First step, download the data.
- Then, as the data contains a pretty large amount of points, the task was to convert it into gridded densities for each of the 26 seabird species. I went for 3km squares, to aggregate the data to a reasonable level, but still keep some of the detail on the maps. I’d consider going a bit coarser, but it does a decent job.
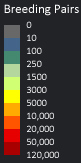
- Once the densities had been calculated, I looked at all the populations and set a sensible set of break-points for the colour map – allowing for consistency across the whole set of species, whilst still giving sensible variation for each one.
- Then, using some nice CSS, javascript and a low-key backdrop map, visualise it on the web in an easy-to-use manner.
Try it out below – just click on the species to update the map:
So, there we have it. A nice, pretty simple visualisation of seabird densities across the British Isles. I think it adds a fair bit of understanding to the raw data, and hopefully works across a broad spectrum of species counts, which is always a tricky thing to get right.
Data
- Seabird data was downloaded from Magic.
- Similar resources exist at SMP and JNCC.
- For a summary of count totals, try this JNCC doc.
Toolboxes
- Point to Raster
- Apply Symbology from Layer
Finally, for an idea of what the raw data looks like, here’s an image showing the density of points (with a background showing the 3km density squares for the puffin). In this case, all the way up in Shetland:

There really are a lot of recording sites – must take a fair amount of research effort!