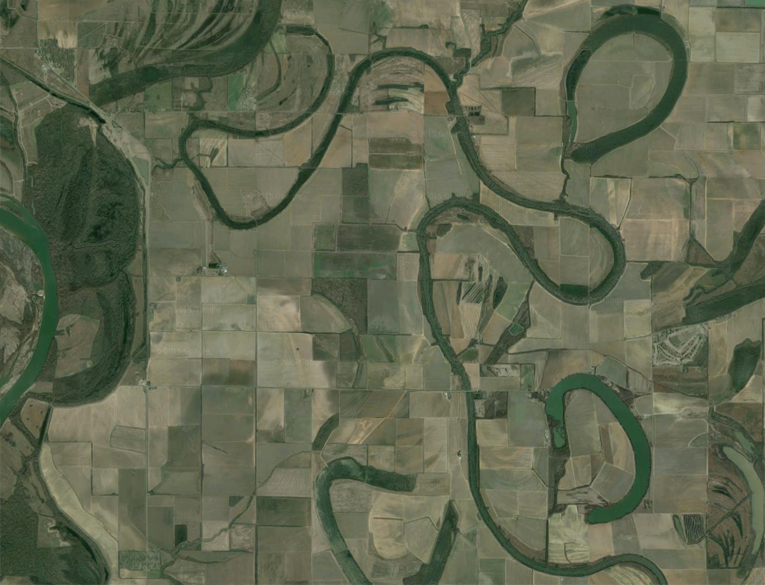
I forget exactly how I first came across this topic, but it’s likely I’d found out there was a town in America called England. When I saw where it was, I panned across the landscape to see a school Geography lesson in action – beautiful meanders in the Arkansas River, oxbow lakes a-plenty, and a patterned landscape showing the history of the river.
The Maps
With this resource of historical maps, it seemed prudent to try and visualise some of the change from then until current aerial imagery. In fact, many were ‘meander maps’, showing the change in the river over time, thus combined with modern imagery, an extension could be provided to the work carried out by surveyors earlier in the century. And all with a few clicks of a mouse sat at a desk – how the world has changed!

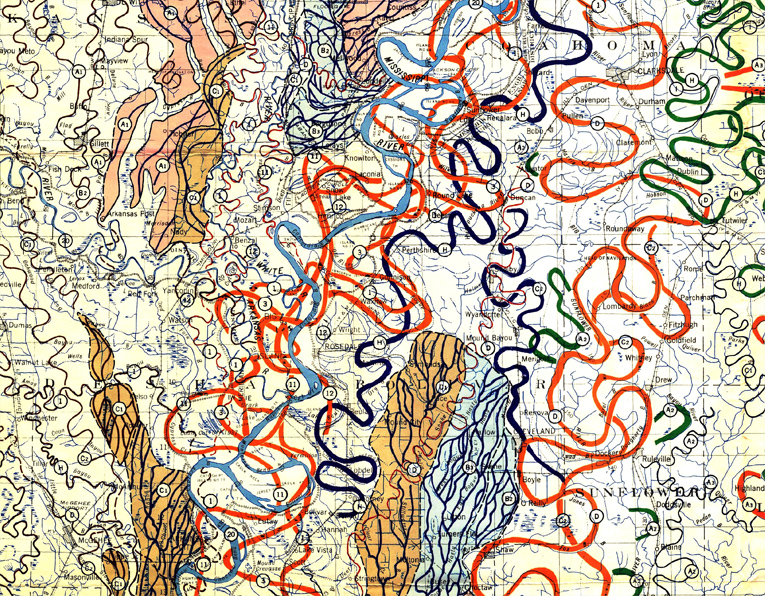
The numbered meanders in the Mississippi show the passage of time
Each color represents an old channel, dating back 1,000 years or so. Those that correspond to historical records are dated, while older channels are ordered according to the principle of superposition.
There were a few blog posts showcasing the maps of the Mississippi, but not much I could find that took the resource one step further, apart from a brief post on NASA’s Earth Observatory site. In fact, the resource provided by the US Army Corps of Engineers even had a small set of georeferenced TIFFs to play with.
England, Arkansas – manual georeference
Starting where it all began, on the meanders of the Arkansas around England. This black and white line map shows the situation as it was in 1967, with a detailed key of geomorphic river forms. Satellite imagery from Google helps to update the area – use the slider in the top right to blend the two maps:

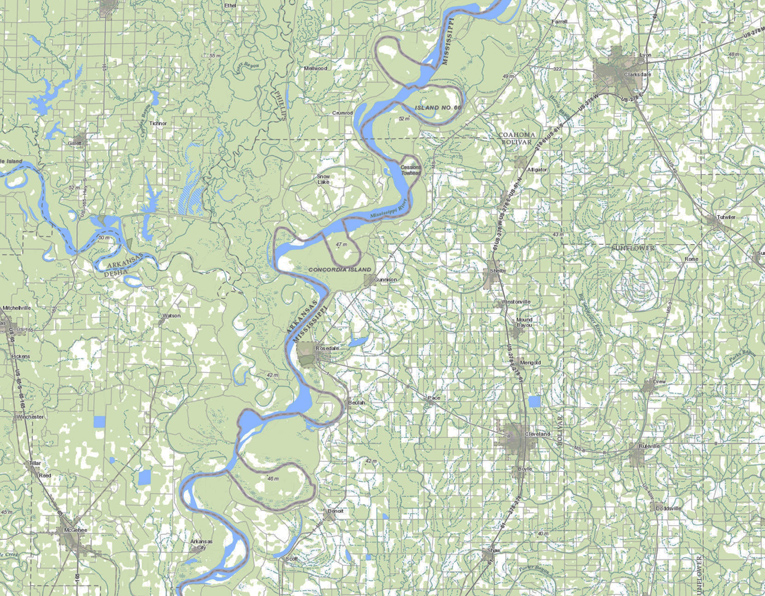
Mississippi-Arkansas Border – georeferenced tiff / basemap
I used one of the georeferenced TIFFs in ArcMap to easily overlay a base map, which shows a number of the meanders on the previous map have since disappeared. You see, what you learn in school really does happen! They’ve done the hard work in this case, so you can just load the data into a GIS and bring in any data you like to overlay (the link to the TIFFs is below in the data section). And what a stunning map! Similar to the static map at the top of he article, historic, recent and present courses of the Mississippi are shown in glorious technicolor:
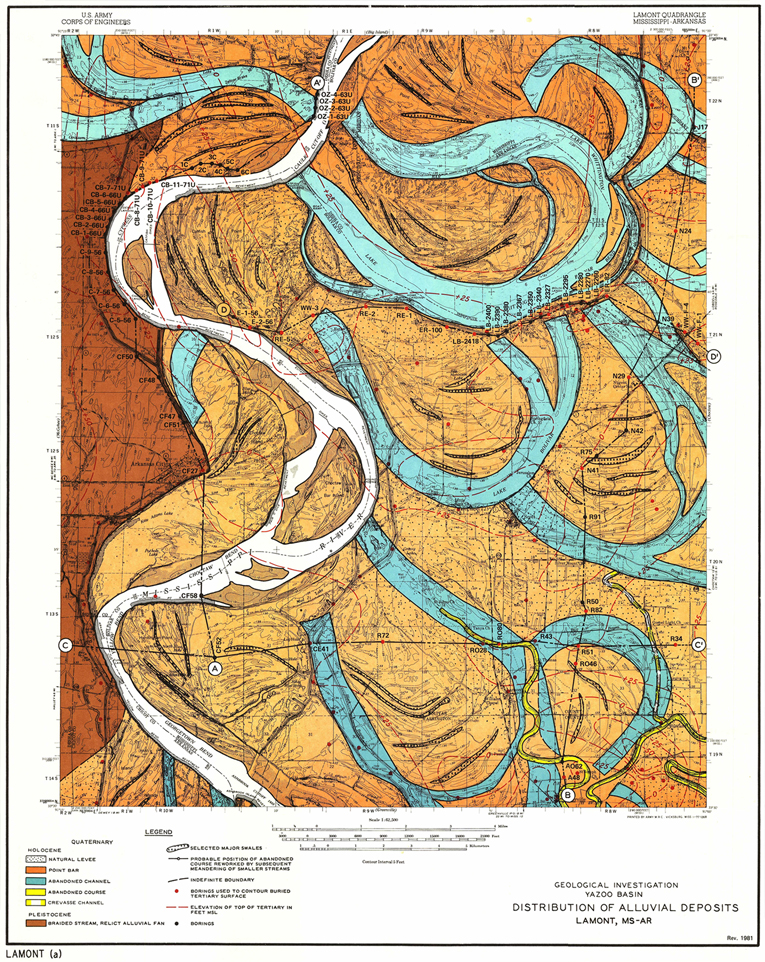
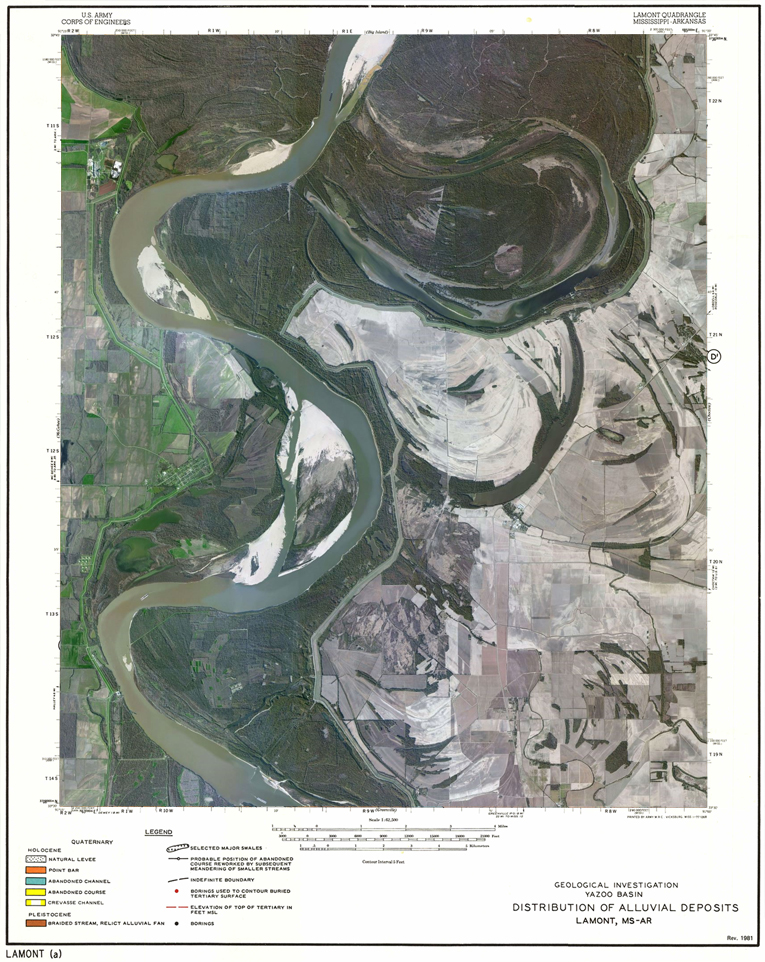
Yazoo River, Lamont – full sheet manual georeference
Is there a better river name than the Yazoo? Seeing that name I had to give it a-mappin’, this time taking a full map sheet from the survey, georeferencing by eye (field boundaries are handy here), then overlaying satellite imagery from Bing (it seemed better than Google for this location). This way you keep all the scale and legends of the original map, with an updated overlay:
Documentation
The 1967 Survey documentation gives great detail on the mapping exercise, including cross-sectional diagrams and numerous photos and explanations worthy of the best school textbooks:
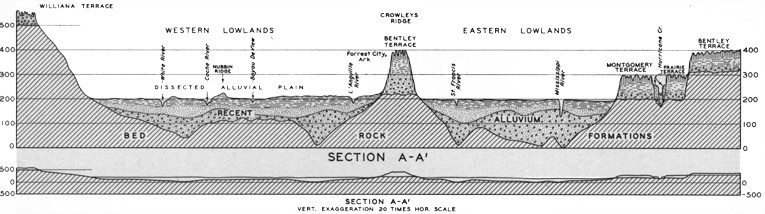
Cross-section of river basins, with vertical exaggeration.

US Army Corps of Engineers, 1967 survey document
Simpler Overlay
Originally, I’d looked at making these transition maps as gifs, but it didn’t offer quite as much as the slider. As an example, here’s the Arkansas-Mississippi border map again, in gif form:

Data
- Arkansas basin – The England map was from Keo district.
- Arkansas-Mississippi border – Sheet 17, NB this is a big download of rectified TIFFs.
- Yazoo basin – The map used was from Lamont.
- Yazoo 1967 Survey documentation.
- The full set of maps from the US Army Corps of Engineers.
Software
- The England and Yazoo aerial photos were taken from Google Maps, overlayed in PhotoShop.
- The Arkansas-Mississippi border map was overlaid on a BaseMap with ArcMap.
- All gifs were made with Gif Maker.
Part Two: The Bones
In trying to display the changes over time of these maps, I ended up creating a system using a combination of jQuery and CSS.
Aligning images on top of eachother
The key here is to be able to fade one image over another. This can be done by manipulating opacity settings, but the images must be aligned. This can be done relatively easily by placing them both in a position:relative div, then setting the images to position:absolute.
Maps CSS
It’s not a complicated setup, just a position:relative container and the tow map divs with position:absolute. Max heights and widths allow us to use 100% widths to allow everything to be scalable, meaning each element will need to be setup to the dimensions of the images you’re using:
 #containmaps{max-width:765px; width:100%; position:relative; margin:0 auto;}

 #backgroundmap {width:100%; max-width:765px; max-height:596px; position:absolute;}

 #topmap{width:100%; max-width:765px; max-height:596px; position:absolute; z-index:3; opacity:0;}
Slider CSS
Not much to this with thanks to jQueryUI – we need to position the slider within each map, nothing to adjust to make this scalable either – it will move towards the top-middle a little with smaller screens, but still look fine. The .ul-slider and .ul-slider-handler classes are the CSS styling built into the jQuery slider object – I’ve used these to give the sliders here a black border, to help them stand out over the map a touch:
 #slider {position:absolute; width: 150px; right:20px; top:22px; z-index:4; border:1px solid black;}

 .ui-slider .ui-slider-handle {border:1px solid black;}
JavaScript
Our use of position:relative images, creates a problem. We want these images to be scalable so they work on all devices, so they can’t have set widths and heights. As position:absolute elements don’t affect the parent div’s dimensions, this means anything coming after these images on the page would be placed immediately below the top of the div – useless!
To make this system workable, we need to use a bit of jQuery to ask for the current height of the image, then set the height of the parent div to this value. Do this on page load and resize, and we’ve got ourselves a workable system:
 $(window).load(function() {

 $('#slider').slider({

 min: 0, max: 1, step: 0.01, value: 0, orientation: "horizontal", slide: function(e,ui{

 $('#topmap').css('opacity', ui.value)}

 })

 var heightLoad = $('#backgroundmap').height();

 $('#containmaps').css("height", heightLoad);

 });

 $( window ).resize(function() {

 var heightResize = $('#backgroundmap').height();

 $('#containmaps').css("height", heightResize);

 });
Bugs with the jQuery Slider
When I loaded these slider maps on WordPress, I found the movement was jolty and delayed. After 2 hours of searching, I found the bug was on a transition effect on all href tags. If you have something like this, it will interrupt the functionality of the slider:
 a {

 -webkit-transition: all 700ms;

 transition: all 700ms;

 }
Page Setup
Now we know everytihing that needs to go into our CSS and JavaScript, just set the page up with the relevant jQuery references, and the files you’ve created. NB the jquery.ui file has the slider object, whilst the standard jQuery library has the underlying code – the touch-punch makes everything work on touch screens as you’d expect:
<script src="jquery.min.js" type="text/javascript"></script>

<script src="jquery-ui.min.js" type="text/javascript"></script>

<script src="jquery.ui.touch-punch.min.js" type="text/javascript"></script>

<script src="meanderMaps.js" type="text/javascript"></script>

<link rel="stylesheet" type="text/css" href="jquery-ui.css">

<link rel="stylesheet" type="text/css" href="meanderMaps.css">