*meiotic*
  • CV
  • InHab50
  • Papers
  • Research
  • Quiz
  • Talks
  • Wanders
  • Whisky

chart.js

Doughnuts and Dots: Chartin’ & Graphin’

Posted on 6th May 201523rd May 2015 by meiotic

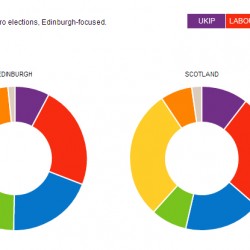
OK, I’m trying to make this topic sound fun.. but there’s only so many ways you can spin online charting libraries.. but if they make delicious donuts and colourful dots, then I might have a

Tagged chart.js, D3.js, data, elections, web Leave a comment


I'm Phil. I live & work in Edinburgh, Scotland. I spend my work time being an Environmental Data Scientist and tweeting about @ScienceAndMaps. I like to cut loose in the Hebrides and am trying to learn the lingo too. I recently passed on the mantle of running the Southside Whisky Club, although I still dabble in the odd whisky expirent with Maltiply and tweet occasionally there too. My research can be further explored on my Research Gate & GitHub, with more visual stuff running on my open source geospatial server, Contours. I carved a spoon and I liked it.